
17 Nov Sales Tax Liability Report vs. Profit & Loss
Sales Tax Liability Report vs. Profit & Loss
(Case Study)
When reconciling the sales tax liability report to the Profit and Loss Standard report, the two reports should, in theory, agree. When they do not match, the issue is usually one of the following:
1. Both reports are not prepared on the same basis (i.e. cash or accrual) or the same time frame.
2. Revenue is entered directly into a bank register or onto a deposit slip. The result is income that is not on the sales tax liability report. Only items entered onto invoices, sales receipts, and credit memos appear on the sales tax liability report.
3. Sales items are not all coded to income type accounts. For example, down payments received from customers have been invoiced but coded to a liability account.
4. Sales items are used for purchases but the advanced job costing features have not been used so the sales and the purchases are both coded to the same general ledger account.
Here is an example for the purposes of illustration:
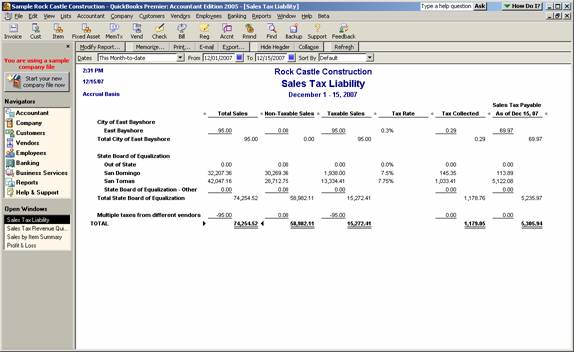
The sales tax liability report shows a total for the period 12-1-07 to 12-15-07 of $74,254.52 on the accrual basis.
QBRA-2005: Reports > Vendors & Payables > Sales Tax Liability Report

The Profit and Loss Standard shows a total for the period 12-1-07 to 12-15-07 of $71,288.05 for total income on the accrual basis.
QBRA-2005: Report > Company & Financial > Profit & Loss Standard

The difference is $2,966.47. The easiest place to start to find the difference is to look at the detail behind the sales tax liability report. Note: In versions of QuickBooks prior to version 2002, this kind of analysis is next to impossible because there is no ability to drill down on the total in the total sales column.
To create a report that is more efficient to work with, create a detail report and sort it by the item.
QBRA-2005: Reports > Vendors & Payables > Sales Tax Liability Report > double check the date range and report basis > double click on the total of the total sales column > Modify Report > Display Tab > place a check mark next to item > OK > Total by: Item detail > Scroll to the bottom and confirm that the total agrees with the total on the summary report.

Now, the first obvious issue to investigate is the “no item” transactions.
By double clicking on the amount and looking at the invoice, it is obvious this is a reimbursed expense.

From the form, click on “journal” to see if the entry was coded to an income account or not. In this case, because the preference has not been chosen to track reimbursed expenses as income the amount does not show as income on the Profit & Loss report. So, this $70.00 is part of the variance. Also, by looking at this same invoice, the $3.50 can be seen as the markup on the reimbursed expense, since this item has been coded to Miscellaneous income it will appear on the Profit & Loss in the income section, even though it does not have an item, it will appear on the sales tax liability report too. This transaction is included in both totals so it is not part of the variance.
Now, as we scroll from the bottom up (i.e. other charge type items first since this is where the differences typically are), there are a couple of obvious differences:
- Bad Check item with sales of $1,200 (typically this item is coded to the bank account, not an income account)
- Bad Chk Chg item with sales of $25 (typically this amount is either offset against the bank service charges if it is a pass through, or to an other income account if it is marked up)
- Retainage2 item with sales of $1,715 (typically this amount is coded to a balance sheet account)
The total of these three items is $2,940. $2,940 plus the $70 reimbursed expense is $3,010 which means we still have a difference of $43.53. At this point there is a decision to be made regarding the cost/benefit of spending time looking for such a small amount. Assuming the amount will be found, this requires digging a little deeper. . .
The next easiest way to try to discover the problem is to do a transaction detail by account report and filter the report for the transaction types of invoice, sales receipt, and credit memo.
QBRA-2005: Reports > Accountant & Taxes > Transaction Detail by Account > Expand Report > Modify Report Display > place a check mark next to item > Filters > Transaction Type > Selected Transaction Types > place a check mark next to invoice, sales receipt, and credit memo

Now, scroll through the transactions looking for anything odd. For example, the first entry in the checking account is OK because the sales receipt was deposited directly, we already addressed the $1,200 entry, then Accounts Receivable is typically OK, as are any inventory or income accounts. What we do notice, however, is that there are finance charge invoices (they typically have FC then a number). The two amounts of $37.58 and $5.95 total the variance of $43.53. The finance charge amounts have been coded to miscellaneous income, but they are not included on the sales tax liability report.