
18 Nov Budget vs. Actual Graph
Posted at 04:54h
in
Budget vs. Actual Graph
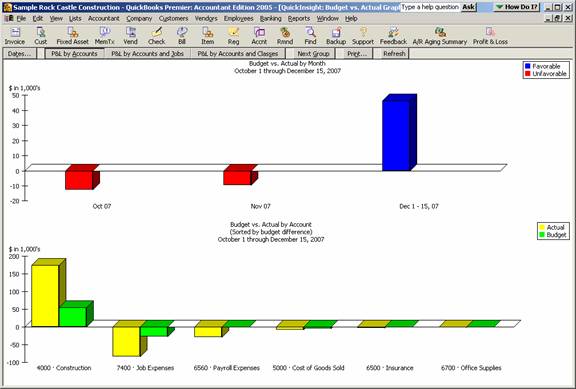
This graph shows the total favorable or unfavorable variance at the top and the budget vs. actual by account at the bottom. It can be changed to P&L by Account and Jobs or P&L by Accounts and Classes depending on how the budget information was entered.
QBRA-2005: Reports > Budgets & Forecasts > Budget vs. Actual Graph
